ESG

An overview of our sustainability performance from an environmental, social and product portfolio perspective, from 2018 to 2022
Area Unit 2018 2019 2020 2021 2022  

SOCIAL

            Ambition 2025
Employees 1              
Organizational health score (OHI) number 58 61 69 72                      72 Top quartile14
Female executives % 20 18 21 22                      26 30
Executive Committee female representation % 29 33 40 43  50 
Supervisory Board female representation % 33 33 38 33 37.5
Culture and change ambassadors number                            300
Executive vacancies filled internally % 54 53 60 68                      62
High potential turnover 2 % 8 4 6 4  N/A 
Total CEO compensation vs median employee
compensation
Ratio 71.3 81.9 126.4 149.0  81.1
Total CEO compensation vs mean employee
compensation 3
Ratio 56.4 65.0 99.2 115.7 59.8
Total employee turnover rate % 14 14 13 14 15
Voluntary employee turnover rate % 8 7 5 8 9
Employees covered by an independent trade union or collective bargaining agreements 4 % 56 56 59 49 45
Number employees number        34,500        33,800           32,200               32,800               35,200
Diversity: Age by gender
<25 % Female  N/A  32% 32% 29% 31%
25 - <35 % Female  N/A  32% 32% 31% 33%
35 - <45 % Female  N/A  26% 26% 26% 28%
45 - <55 % Female  N/A  25% 25% 23% 23%
55 - <65 % Female  N/A  20% 21% 20% 20%
≥ 65 % Female  N/A  11% 12% 15% 16%
Total % Female  N/A  25% 25% 26% 27%
Diversity: Functions by gender
Facilities % Female  N/A  53% 46% 44% 46%
General Management % Female  N/A  50% 40% 55% 51%
Integrated Supply Chain % Female  N/A  14% 14% 15% 14%
Research  Development & Innovation % Female  N/A  35% 34% 35% 35%
Sales & Marketing % Female  N/A  26% 27% 27% 29%
Support % Female  N/A  55% 54% 54% 55%
Diversity: Management level by gender
Executive % Female  N/A  18% 20% 22% 26%
Senior MM level18 % Female  N/A  27% 27% 28% 31%
Junior MM level % Female  N/A  29% 30% 30% -
G level % Female  N/A  24% 23% 24% 24%
Ungraded % Female  N/A  N/A N/A N/A 25%
Diversity: Gender split per region
North America % Female  N/A  19% 19% 19% 20%
South America % Female  N/A  22% 22% 23% 27%
EMEA % Female  N/A  29% 29% 30% 30%
North Asia % Female  N/A  23% 23% 23% 24%
South Asia Pacific % Female  N/A  19% 19% 20% 21%
               
People and process safety             Ambition level
Fatalities employees number 0 2 0 1 0
Total reportable injury rate employees/temporary workers /200,000 hours 0.20 0.24 0.23 0.21 0.236 0.2
Lost time injury rate employees/temporary workers /200,000 hours 0.09 0.08 0.09 0.11 0.126
Occupational illness rate employees /200,000 hours 0.012 0.003 0.010 0.003 0.003
Occupational illness frequency rate (OIFR)  /1,000,000 hours 0.05 0.03 0.04 0.01 0.01
New Wellness Checkpoint participants number             446             388 740 1776 115
Total illness absence rate employees % 1.98 2.17 2.59 2.66 3.24
Fatalities contractors (temporary workers plus independent) number 0 0 0 0 0
Total reportable injury rate contractors /200,000 hours 0.18 0.19 0.17 0.12 0.212
Lost time injury rate contractors /200,000 hours 0.07 0.09 0.11 0.08 0.064
Life changing injuries number 3 3 2 2 1
Distribution incidents number 21 26 15 14 12
Loss of primary containment – Level 1 number 6 3 6 5 2
Loss of primary containment – Level 2 number 63 64 52 67 51
Regulatory actions – Level 3 number 2 3 0 2 1
Regulatory actions – Level 4 number 1 0 0 0 0
Priority substances with management plan % 100 100 100 100 100 100
Security events Level 3 number 0 0 0 4 0
               
HSE management              
Safety incidents (Level 3) number 0 2 0 2 0
Safety incidents (Levels 1, 2, 3) number 3 3 2 5 1
Management audits plus reassurance audits number 25 32 28 29 33
Management audits plus reassurance audits percentage 27
Environmental certification  ISO 140015 % of manufacturing sites 77 75 76 80 78
Health and Safety Management certification - ISO 450015 % of manufacturing sites 55 53 53 57 55
               
AkzoNobel Cares             Ambition 2020-2030
Members of local communities empowered with new skills number 4,276 4,078 2,669 11,193 24,225 100,000+
AkzoNobel Cares projects number 126 225 170 182 239 2,000+
               

ENVIRONMENTAL

            Ambition 2030
Energy use and emissions              
Total energy use 6 1000TJ 6.20 6.02 5.69 6.33 5.91
 per ton of production GJ/ton 1.91 1.88 1.83 1.89 1.90 30% less15
Renewable energy (own operations) % 31 31 33 37 41
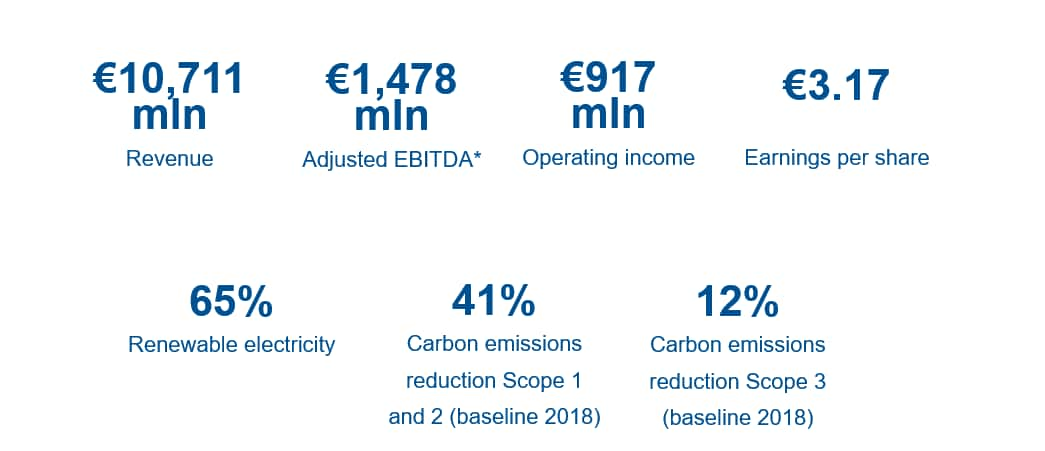
Renewable electricity (own operations) % 38 37 40 45 50 100
Greenhouse gas emissions – Direct CO2(e) emissions (Scope 1) 7 kiloton 62.9 58.3 57.2 64.5 60.1
 per ton of production kg/ton 19.42 18.18 18.42 19.27 19.35
Greenhouse gas emissions – Indirect CO2(e) emissions (Scope 2) kiloton 226.0 183.1 168.2 172.1 147.5
 per ton of production kg/ton 69.77 57.13 54.22 51.41 47.45
Total Greenhouse gas emissions – Scope 1 and Scope 2 combined CO2(e) emissions kiloton 288.92 241.45 225.38 236.60 207.6 50% less 15
per ton of production   89.19 75.31 72.64 70.68 66.8  
Volatile organic compounds (VOC) kiloton 1.57 1.19 0.95 0.96 0.83
 per ton of production kg/ton 0.49 0.37 0.31 0.29 0.27
NOx emissions kiloton 0.1 0.1 0.1 0.07 0.07
 per ton of production kg/ton 0.02 0.02 0.02 0.02 0.02
SOx emissions kiloton 0.02 0.04 0.03 0.03 0.03
 per ton of production kg/ton 0.01 0.01 0.01 0.01 0.01
               
Resource efficiency              
Total waste kiloton 67 67 62 67 59
 per ton of production kg/ton 20.97 21.00 19.96 19.87 18.95
Circular use of materials16 % 52 55 57 58 56 100
Total reusable waste kiloton 33 34 32 35 29
Total non-reusable waste kiloton 34 33 30 31 30
 per ton of production kg/ton 10.63 10.28 9.57 9.39 9.68
Hazardous waste total kiloton 30 29 28 31 28
 per ton of production kg/ton 9.13 9.07 8.93 9.19 9.15
Non-hazardous waste total kiloton 37 38 34 36 30
Hazardous waste non-reusable kiloton 15 14 15 17 17
 per ton of production kg/ton 4.59 4.46 4.70 4.95 5.36
Total Hazardous waste reusable % of hazardous waste 50 51 47 45 41  
Hazardous waste to landfill kiloton 0.69 0.45 0.23 0.11 0.14
 per ton of production kg/ton 0.21 0.14 0.07 0.03 0.05
Non-hazardous waste to landfill kiloton 10.93 9.40 6.22 1.39 1.12  
Total waste to landfill kiloton 11.6 9.8 6.5 1.5 1.3 Zero (<1% of total waste)
Total freshwater use million m3 9.27 8.05 9.12 9.56 8.63
per ton of production m3/ton 2.86 2.51 2.94 2.86 2.78
Total fresh water consumption (excluding water related to product) million m3       1.27 1.14
per ton of production m3/ton       0.38 0.37
COD emissions kiloton 0.03 0.02 0.02 0.03 0.03
per ton of production kg/ton 0.01 0.01 0.01 0.01 0.01
               
Supplier management             Ambition 2025
PR8 suppliers signed Business Partner CoC9 % of spend 98 98 98 99 99
NPR8 suppliers signed Business Partner CoC9 % of spend 83 84 89 89 93
Suppliers participating in sustainability program % against baseline 60 65 75 84 77 Close to 100
Suppliers in sustainability program - under development % against baseline 22 18 24 27 24
Suppliers in sustainability program - in line with our expectation % against baseline 38 47 51 57 52
Third party on-site sustainability audits (TfS)10 number   263 315 313 298
               

PRODUCT PORTFOLIO

            Ambition 2030
Sustainable product portfolio and product safety              
Sustainable solutions 11 % of revenue       39 40 >50
Eco-premium solutions 11 % of revenue 22 22 21
               
Value chain emission12              
Renewable raw materials % organic RM 5 5 5 5 5  
 Cradle-to-grave carbon footprint
(Scope 1, 2 and 3) - Total
million tons 14.9 14.4 13.4 15.1 13.8
 Cradle-to-grave carbon footprint
(Scope 1, 2 and 3) - Selected scope 313
million tons 14.3 13.8 12.8 14.7 13.4
Cradle-to-grave with selected scope 3 as part of total cradle-to-graven carbon footprint in % of total carbon footprint 96 96 96 97 95
Scope 3 upstream selected categories13 million tons 6.5 6.3 5.9 6.8 6.2
Scope 3 downstream selected categories million tons 7.5 7.3 6.7 7.7 7.0
Scope 3 - upstream and downstream combined19 million tons 14.0 13.6 12.6 14.5 13.2 50% less15
Scope 3, category 1. Purchased goods and services million tons CO2 (e) (estimated) 6.5 6.3 5.9 6.8 6.2
Scope 3, category 2. Capital goods million tons CO2 (e) (estimated) 0.4 0.4 0.4 0.03 0.03
Scope 3, category 3. Fuel- and energyrelated activities million tons CO2 (e) (estimated) <0.1 <0.1 <0.1 <0.1 <0.1
Scope 3, category 4. Upstream transportation and distribution million tons CO2 (e) (estimated) 0.0 0.0 0.1 0.2 0.2
Scope 3, category 5. Waste generated in operations million tons CO2 (e) (estimated) <0.1 <0.1 <0.1 <0.1 <0.1
Scope 3, category 6. Business travel  million tons CO2 (e) (estimated) <0.1 <0.1 <0.1 <0.1 <0.1
Scope 3, category 7. Employee commuting million tons CO2 (e) (estimated) <0.1 <0.1 <0.1 <0.1 <0.1
Scope 3, category 8. Upstream leased assets million tons CO2 (e) (estimated) <0.1 <0.1 <0.1 <0.1 <0.1
Scope 3, category 9. Downstream transportation and distribution million tons CO2 (e) (estimated) 0.1 0.1 0.1 0.2 0.2
Scope 3, category 10. Processing of sold products17 million tons CO2 (e) (estimated) (Included in use) (Included in use) (included in use) (included in use) 5.5
Scope 3, category 11. Use of sold products17 million tons CO2 (e) (estimated) 5.9 5.7 5.2 6 (included in processing)
Scope 3, category 12. End-of-life treatment of sold products million tons CO2 (e) (estimated) 1.6 1.6 1.5 1.7 1.5
Scope 3, category 13. Downstream leased assets million tons CO2 (e) (estimated) <0.1 <0.1 <0.1 <0.1 <0.1
Scope 3, category 14. Franchises million tons CO2 (e) (estimated) <0.1 <0.1 <0.1 <0.1 <0.1
Scope 3, category 15. Investments million tons CO2 (e) (estimated) <0.1 <0.1 <0.1 <0.1 <0.1

Notes:

1 – Due to privacy law, such as GDPR, we are not allowed to collect certain diversity data from our employees in certain regions, other than gender. Therefore, we currently only disclose gender diversity at consolidated level.

2 – In 2020 we changed the definition of our high potential turnover, which is now: High performers (scoring a 4 or 5 in their P&DD for the past 2 years) who leave the organization voluntarily or as part of a redundancy.

3 – The 2020 increase is mainly due to the 2020 Performance Incentive Plan payment. Without this one-off special payment, the ratio would have been 62.3. The 2021 CEO pay ratio seems to be higher due to the reappointment grant of 17,500 shares and a lower average salary per employee. Without the reappointment grant, the ratio would be 82.4.

4 – We operate in some countries where the right to exercise freedom of association and collective bargaining may be at risk. We ensure that systems are in place for employee involvement and engagement in line with company values and HR policies, for example by inclusion in the Code of Conduct.

5 – This percentage covers manufacturing sites under our Global group certification. Some sites are certified against local standards and are not covered in the group certificate. The year-on-year differences can be explained by site closures.

6 – The 2021 number includes a baseline shift of 199 TJ, or 3.5%, due to central procurement of electricity, elevating part of the stores organization above the materiality level.

7 – We have restated our 2018 Scope 1 emissions due to a temporary database outage in the prior year leading to misstated values.

8 – PR stands for Product-related and NPR for Non-product related.

9 – CoC stands for Code of Conduct.

10 – Third party on-site sustainability audits. This includes Together for Sustainability (TfS) shared audits, cumulative. Includes re-auditing sites in high-risk regions.

11 – As of 2021, we report on sustainable solutions instead of eco-premium solutions. The reporting period for both eco-premium as well as sustainable solutions is November-October.

12 – We have restated our 2018-2019 Scope 3 downstream and upstream due to improvement of methodology by better incorporating raw material formulation. The reporting period for Scope 3 remains October-September.

13 – This includes: Upstream Category 1 (purchased goods and services including packaging), Downstream: Category 10 - processing of sold products; Category 11 - use of sold products; Category 12 - end-of-life treatment of sold products and VOC emissions in processing/use.                                                        

14 – Since we’re striving to achieve top quartile on an ongoing basis, the OHI ambition is not tied to the 2025 time frame.

15 - Interim target for 2025 is 25%. Both targets versus 2018 baseline.

16 - The 2020 and 2021 figures for circular use of materials have been restated, reflecting an incorrect classification of by-product for one of our production sites.

17 – We changed the reporting category for the joint use and processing stage to category 10 on request of the Science Based Targets initiative (SBTi) and to better reflect in which stage the emissions actually occur.

18 – Since 2022, we merged both Senior and Junior MM levels.


Reporting principles

Please see our reporting principles for definition on above KPIs

Get the full picture for 2022

For a detailed summary of our financial and sustainability performance in 2022, read the online version of our integrated Report 2022.


Fetching the data, please wait...